
Today’s Market Watch is more educational in nature than observational. We will be discussing the 3 most talked about market indexes. We discuss what the indexes are, why they are so widely used, and how we should view them as investors. First off, we will start with the definition of “Index”.
“An index measures the price performance of a basket of securities using a standardized metric and methodology. Indexes in financial markets are often used as benchmarks to evaluate an investment’s performance against.” (Investopedia). Index can be pluralized as either “indexes” or “indices”.
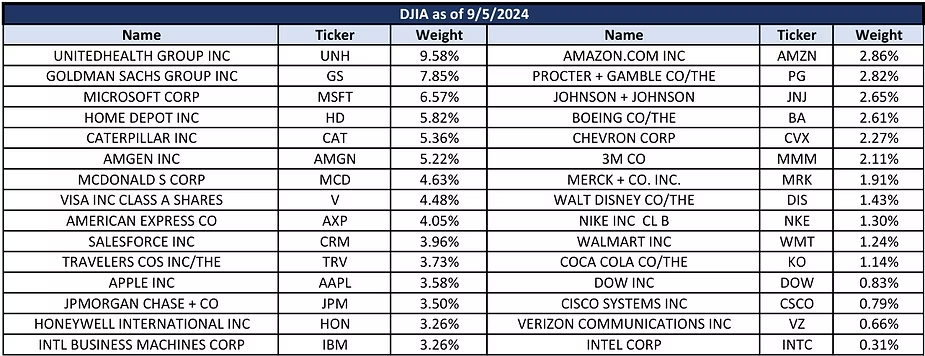
DJIA – Dow Jones Industrial Average
The DJIA is the oldest of the three most watched indexes and was created in 1896 by Charles Dow. It now consists of 30 companies that are considered influential in their sectors. Note, it does not include any stocks from the transportation or utility sectors. These two sectors are tracked by their own separate indexes, the Dow Jones Transportation Average (DJTA) and the Dow Jones Utility Average (DJUA).
It is a price-weighted index which means each stock is weighted by its price per share and the index is the average of all the prices. Higher priced stocks have more influence on the index than lower priced stocks. The DJIA uses a Dow divisor that is adjusted to ensure corporate actions like stock splits, stock dividends, spinoffs, etc. do not impact the DJIA price. In other words, the divisor is adjusted so that changes in the DJIA purely reflect price changes of the stocks. A limitation of price-weighted indexes is that they can give much more influence to higher priced stocks. For example, a stock that goes from $1,000 per share to $1,010 per share will move the index more than a stock that goes from $10 per share to $20. Even though $10 to $20 is a 100% increase in value.
S&P 500 – Standard & Poor’s 500
The index was created in 1957. It represents the largest publicly traded companies in the United States and is commonly used as a proxy for the performance and health of the broader U.S. market. While it can be a good economic indicator, it needs to be used in context as it does not reflect small or mid-capitalization stocks, or the private market.
The index is market capitalization weighted. Market capitalization is a size measure of a company that is calculated as the current share price multiplied by the number of shares outstanding. To be included in the index, a company must have a market cap greater than $8.2 billion, but all the index constituents have much higher capitalizations than that. As of writing, the smallest stock in the index is News Corporation (NWS) at a market cap of $15.3 billion. The bullets below lay out market cap classification ranges.
- Mega-cap: Companies with a market cap of $200 billion or more
- Large-cap: Companies with a market cap of $10 billion to $200 billion
- Mid-cap: Companies with a market cap of $2 billion to $10 billion
- Small-cap: Companies with a market cap of $250 million to $2 billion
- Micro-cap: Companies with a market cap of less than $250 million
The index has 500 companies represented in it, but 503 stocks. This is because 3 of its constituent companies have two share classes of their stock in the index.
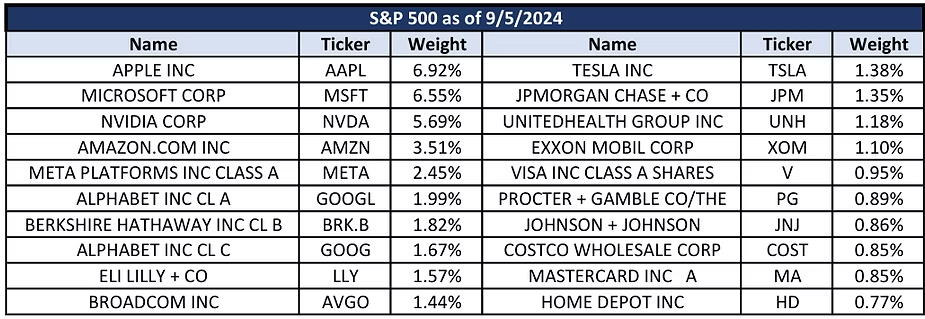
If you invest in an S&P 500 index ETF, are you well diversified?
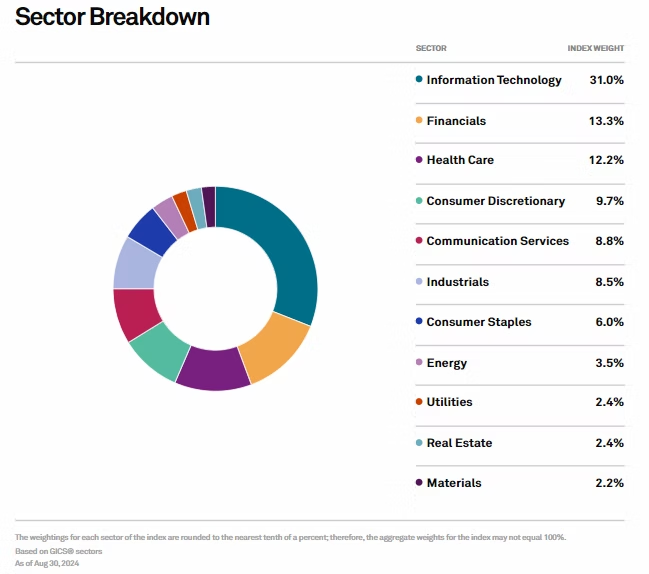
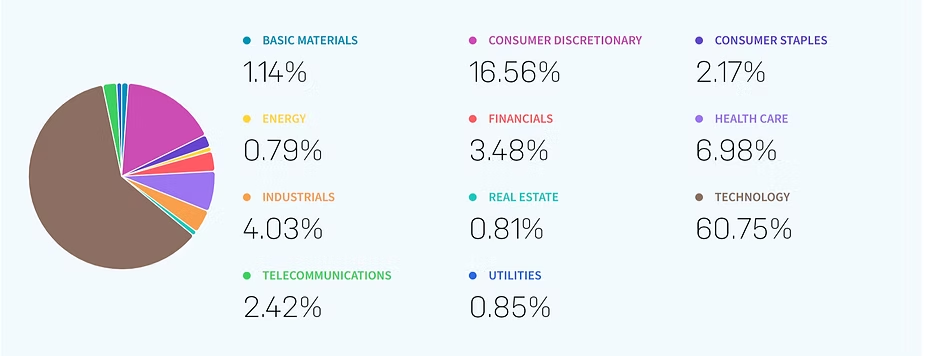
Objectively, you do own a portion of 500 companies. However, the exposure that results from owning an S&P 500 index ETF is largely disproportionate to the technology sector and a dominant group of stocks: Apple, Microsoft, Nvidia, Amazon, Meta, and Alphabet (Google). The dominance of these companies in the index is driven by the aforementioned market capitalization weighting method for the index. Bigger companies have bigger influence. The technology sector proportion fluctuates, but it tends to hover around 30% of the index. So for every $100 dollars you invest in an S&P 500 index fund, about $30 of it will be invested in technology. And let’s look at the bottom half of the index and how much you will have invested in those based on $100:
- 1 cent invested in each stock from 496-503
- 2 cents each in stocks 451-495
- 3 cents each in stocks 400-450
- 4 cents each in stocks 347-399
- 5 cents each in stocks 307-346
- 6 cents each in stocks 272-306
- 7 cents each in stocks 250-271
In our opinion, owning just an S&P 500 index is not sufficient diversification due to the the index’s concentration. It can still have a place as a position in an investment portfolio, but investors should be aware that they are mostly exposed to the top 20 stocks of the index.
Nasdaq Composite
The National Association of Securities dealers founded the Nasdaq in 1971 as the worlds first electronic stock exchange. The Nasdaq Composite index includes the entire universe of stocks listed on the exchange which represents over 3,000 companies and a market cap of $22.4 trillion. The Nasdaq is heavily weighted toward technology with 61% of the index being classified as tech. Another commonly referenced Nasdaq index is the Nasdaq 100, which differs from the composite since it only includes the 100 largest stocks listed on the exchange, rather than all of them.
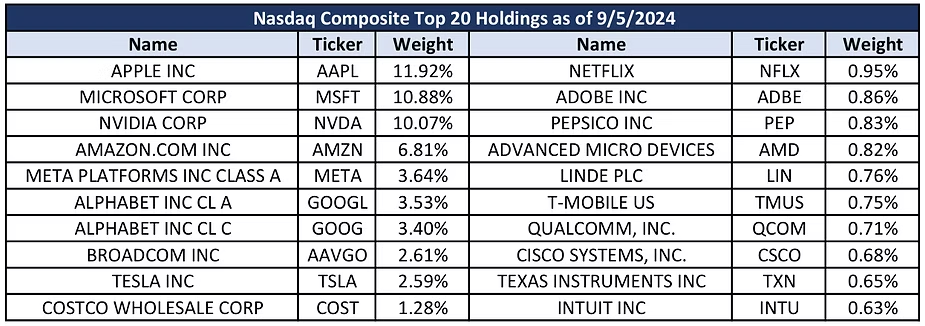
Investors who desire exposure to the Nasdaq commonly do so through vehicles such as the ticker symbol QQQ, which is an ETF created by Invesco to track the Nasdaq-100 index. Note, these major market indexes are not directly investable themselves. But almost all of the major brokerages offer an ETF investment product to track these indexes. Investing in a Nasdaq ETF would result in exposure to mostly large cap technology stocks. And it is important to compare the top 20 holdings of both the S&P 500 and Nasdaq and notice how many stocks overlap between the two.
Are these indexes good economic indicators?
These indexes are the subject of headlines and will be the most discussed in financial news, especially on days when the market drops. They are most useful as economic indicators when used in the context other indicators as well. Notice that all three indexes share a lot of the same companies. There is also a strong technology sector bias and a large capitalization tilt across all three. These indexes can provide useful information on the performance of those types of stocks and sector, and also general investor sentiment. But they are not a comprehensive perspective on the U.S. economy.
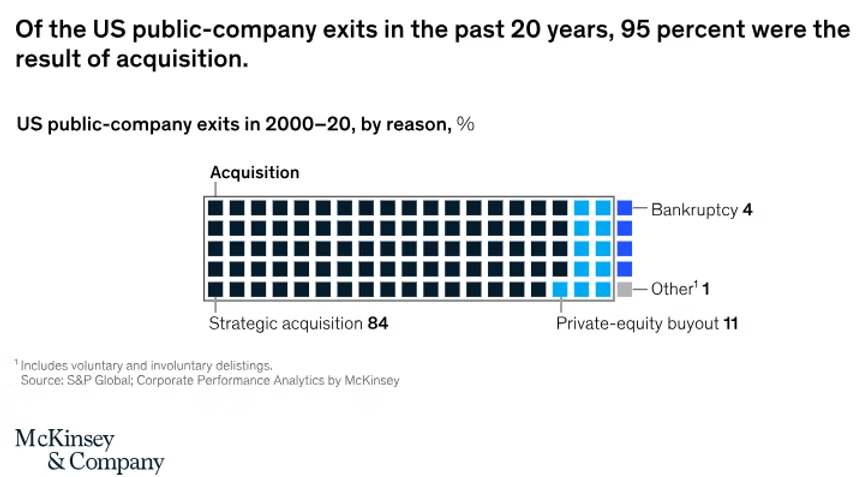
Not well represented in these indexes are the private markets and smaller companies. It is worth noting that the number of publicly traded companies peaked in the 1990s with estimates between 7000-8000 publicly traded companies. Now, the number of publicly traded companies sits in the 4000s. Most of this has been driven by companies being taken private by acquisition.
We share this just to show that even though these indexes are important, they are not representative of the entire economy. When hearing or seeing headlines about them, it is important to place them in context and understand what they represent.
We thank you all for taking the time and reading “Market Watch.” It is meant as an educational piece on the always evolving markets. It is something we plan on providing every month, and your feedback is very important to us.
On a personal note, RMH is now in the position to bring on new clients so please be sure to share this informational letter with whomever you wish. RMH’s focus is on the customizable investment needs of individuals, families, and foundations. We enjoy working with our clients to better understand their goals, values, and passions for what is important in their lives. In expanding our client base, we look forward to working with people who share these same desires.
Ashlyn Tucker, M. Fin, Analyst, CFA Level III Candidate
Richard Mundinger, CFA